Categories
Housing MarketPublished April 21, 2026
Market Update: March 2026


Spring has officially sprung, and the Portland Metro real estate market is seeing a substantial seasonal surge! The March 2026 numbers are in, revealing significant month-over-month double-digit increases in new listings, pending sales, and closed transactions. Whether you are a prospective buyer or a seller preparing to list, understanding these local trends is key to navigating the current landscape.
Market Highlights: The Spring Surge is Here
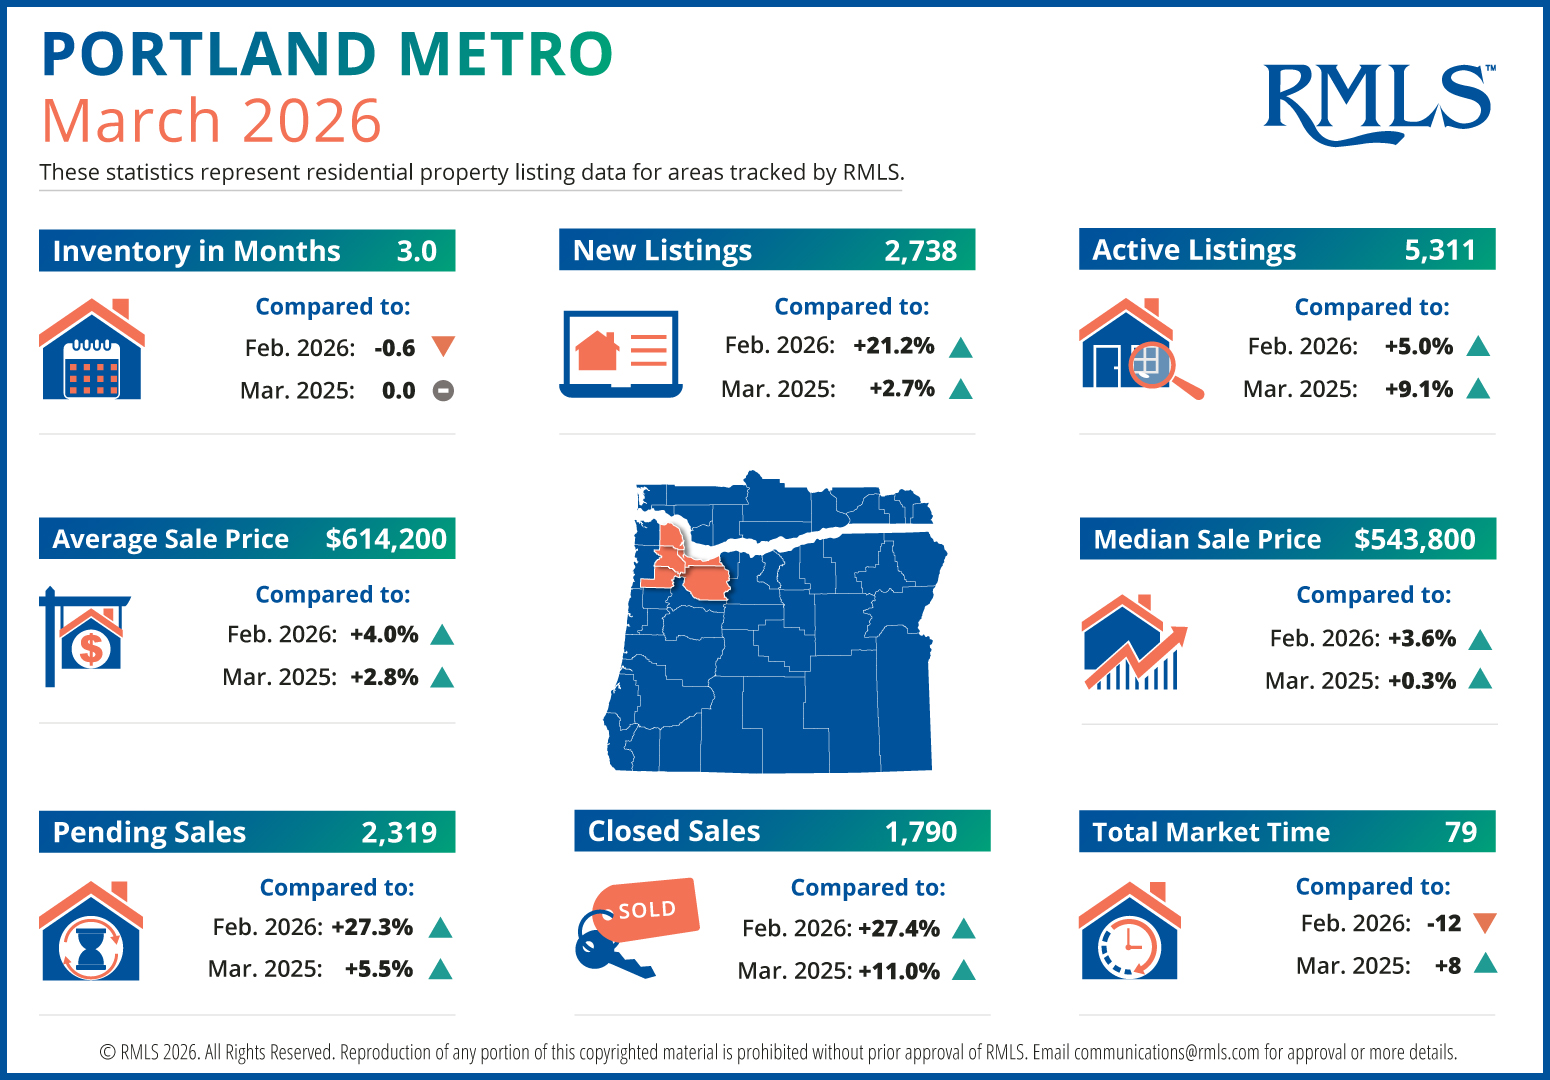
Activity took a sharp upward turn in March compared to February, reflecting a robust spring market. Here is how the numbers break down:
- New Listings: 2,738 new properties hit the market. This is a massive 21.2% jump from February 2026 and a 2.7% increase compared to March 2025.
- Pending Sales: Buyers were incredibly active, with 2,319 offers accepted—an impressive 27.3% increase from the previous month and up 5.5% year-over-year.
- Closed Sales: 1,790 homes successfully closed, surging 27.4% from February and 11.0% higher than the 1,613 closings we saw in March of last year.
Inventory and Time on Market
With homes selling at a faster clip, the Total Market Time dropped to 79 days. Consequently, the housing inventory decreased to 3.0 months in March. For context, an inventory of 4 to 6 months is generally considered a balanced market, meaning Portland is currently leaning toward a seller's market.
| Inventory in Months (Q1 Comparison) | ||
|---|---|---|
| Month | 2025 | 2026 |
| January | 3.7 | 4.3 |
| February | 3.2 | 3.6 |
| March | 3.0 | 3.0 |
Average and Median Sale Prices
Despite the bump in overall sales volume, prices have softened slightly compared to the start of last year. Looking at the Year-To-Date (YTD) summary through the first three months of 2026:
- The Average Sale Price decreased 1.4%, moving from $603,000 in early 2025 to $594,500 this year.
- The Median Sale Price saw a 2.8% dip, settling at $525,000 compared to $540,000 during the same period in 2025.
Where Are Homes Selling? (Sales by Price Range)
The "sweet spot" for Portland Metro buyers remains heavily concentrated in the mid-tier price ranges. In March 2026, over 54% of all closed residential sales occurred between the $400,000 and $700,000 price points.
| Price Range | Total Closed Sales (Mar 2026) | % of Total Market |
|---|---|---|
| $300K - $400K | 216 | 12.1% |
| $400K - $500K | 386 | 21.6% |
| $500K - $600K | 341 | 19.1% |
| $600K - $700K | 250 | 14.0% |
| $700K - $800K | 160 | 8.9% |
| $800K - $900K | 103 | 5.8% |
Affordability & Move-In Ready Inventory
For buyers keeping an eye on interest rates and budget, the region maintains an encouraging Affordability Index. A family earning the median income of $124,100 can currently afford 98% of a monthly mortgage payment on a median-priced home ($543,800 for the month of March), assuming a 20% down payment and a 6.1% fixed interest rate.
Additionally, if you are looking to move fast, there is good news: 91.6% of the active listings in the Portland Metro area are ready for purchase and occupancy immediately (not pending construction). That leaves us with 4,864 move-in-ready listings, equating to about 2.7 months of occupancy-ready inventory.
Thinking about making a move in the Portland Metro area? Whether you're looking to capitalize on the lower inventory as a seller or wanting to lock in a home before the peak summer rush as a buyer, having an expert by your side is vital. Contact us today to learn how these market trends impact your specific neighborhood and real estate goals!
|


or another way